Economic Briefing November 2023
Headline Inflation: inflation has fallen to 4.6%, down from 6.7% in September, but food inflation remains high at 10.1%.
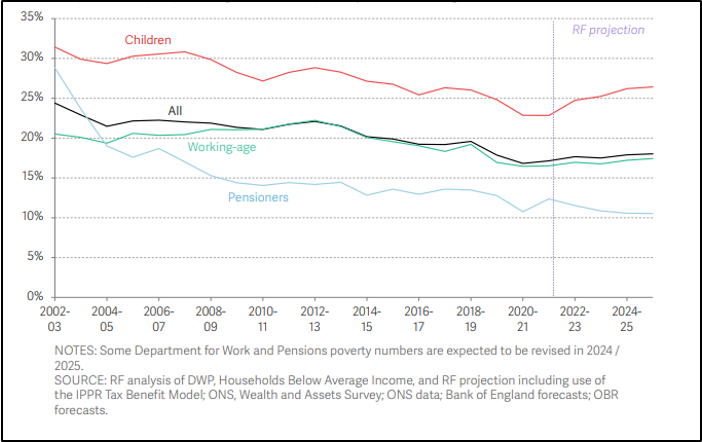
Increased costs have reduced household disposable incomes: Resolution Foundation have projected an additional 300,000 people will be pushed into absolute poverty next year as a result.
The ONS’ Labour Force Survey release continues to be delayed: This has sparked concerns over the reliability of survey, as data during and after the pandemic saw response rates plummet among certain age groups.
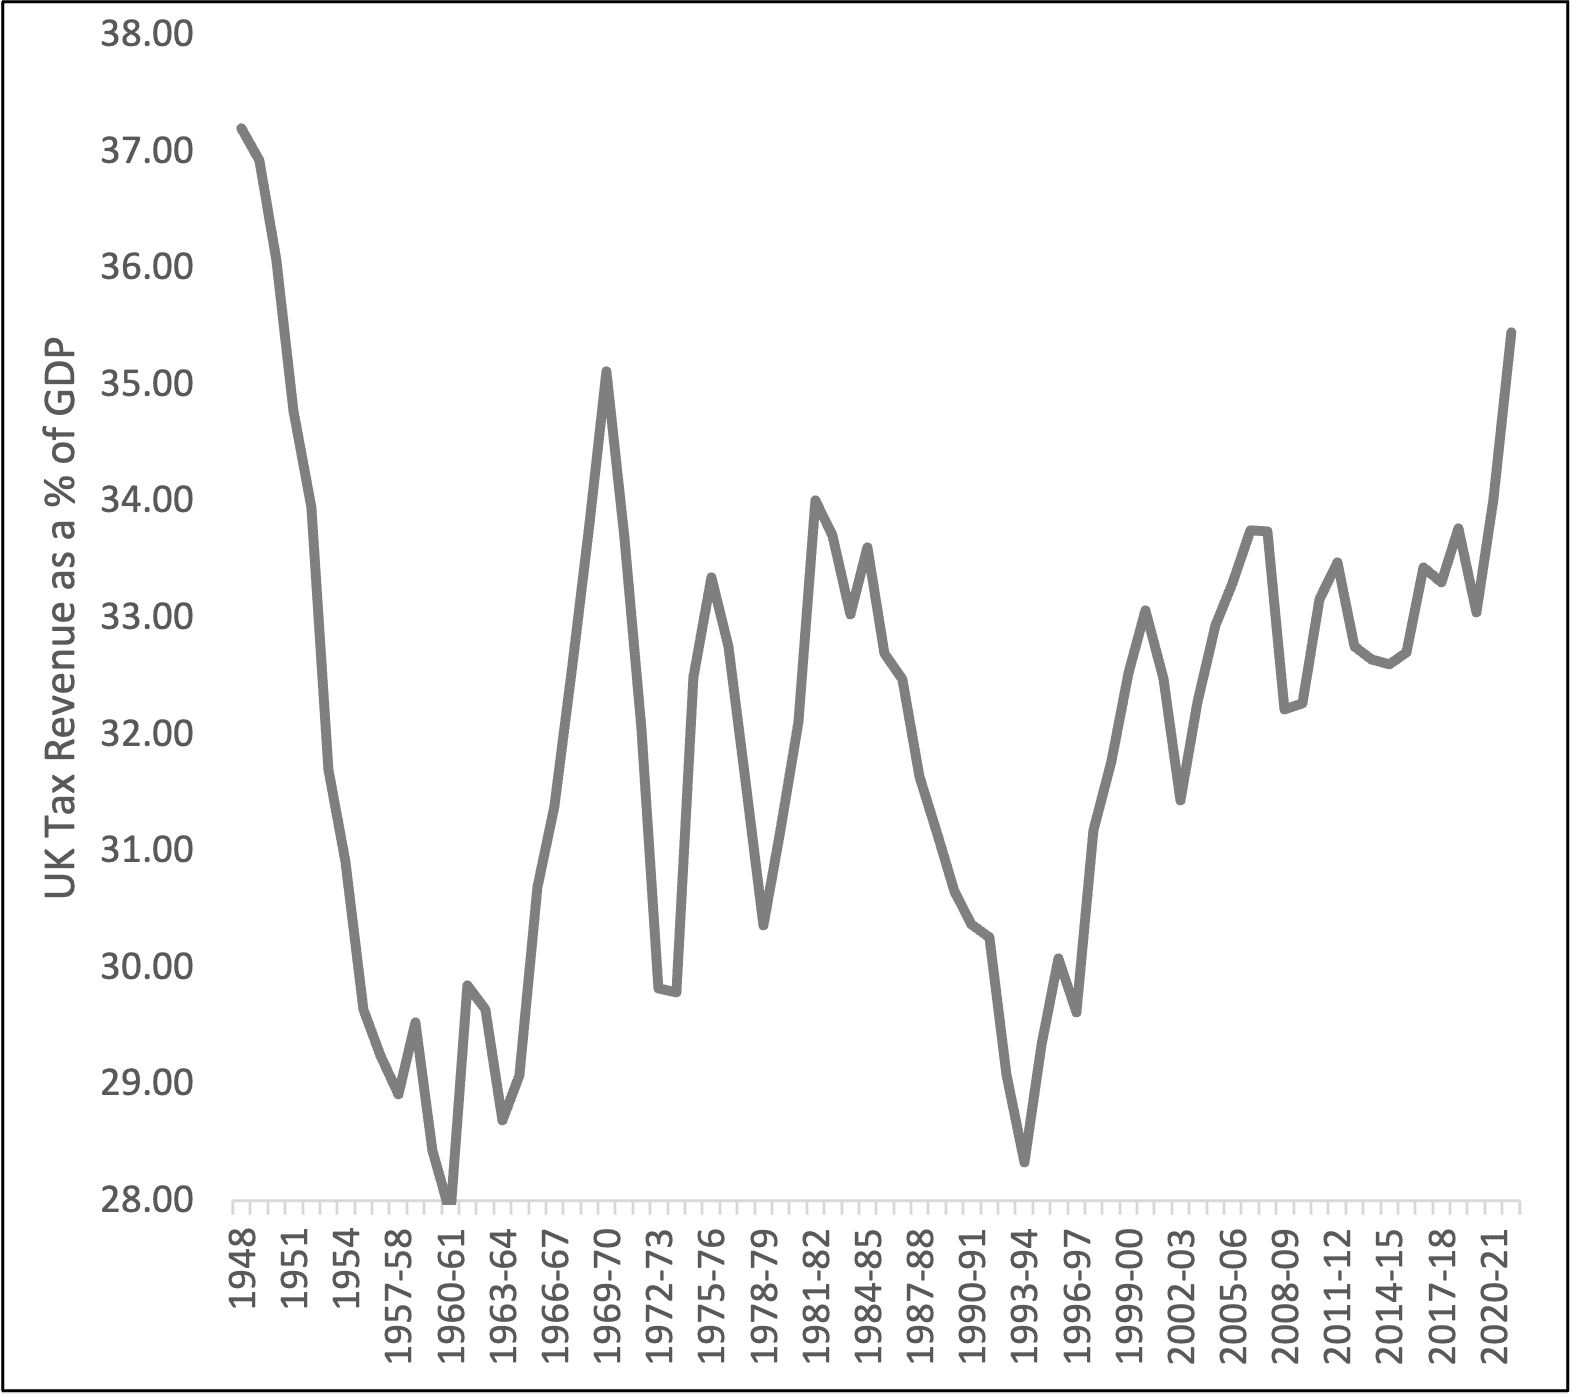
Tax Burden: Despite the Autumn Statement’s announcement of tax cuts, the UK’s tax burden remains at a 70 year high. The process of fiscal drag is predicted to raise £45bn by 2029, compared to the cost of the cuts to National Insurance predicted to cost the treasury £10bn.
SPOTLIGHT ON:
This month’s spotlight is on the Inclusive Growth Agenda:
A high tax burden, alongside the UK’s poor outlook for economic growth seen in the UK creates a difficult fiscal policy environment.
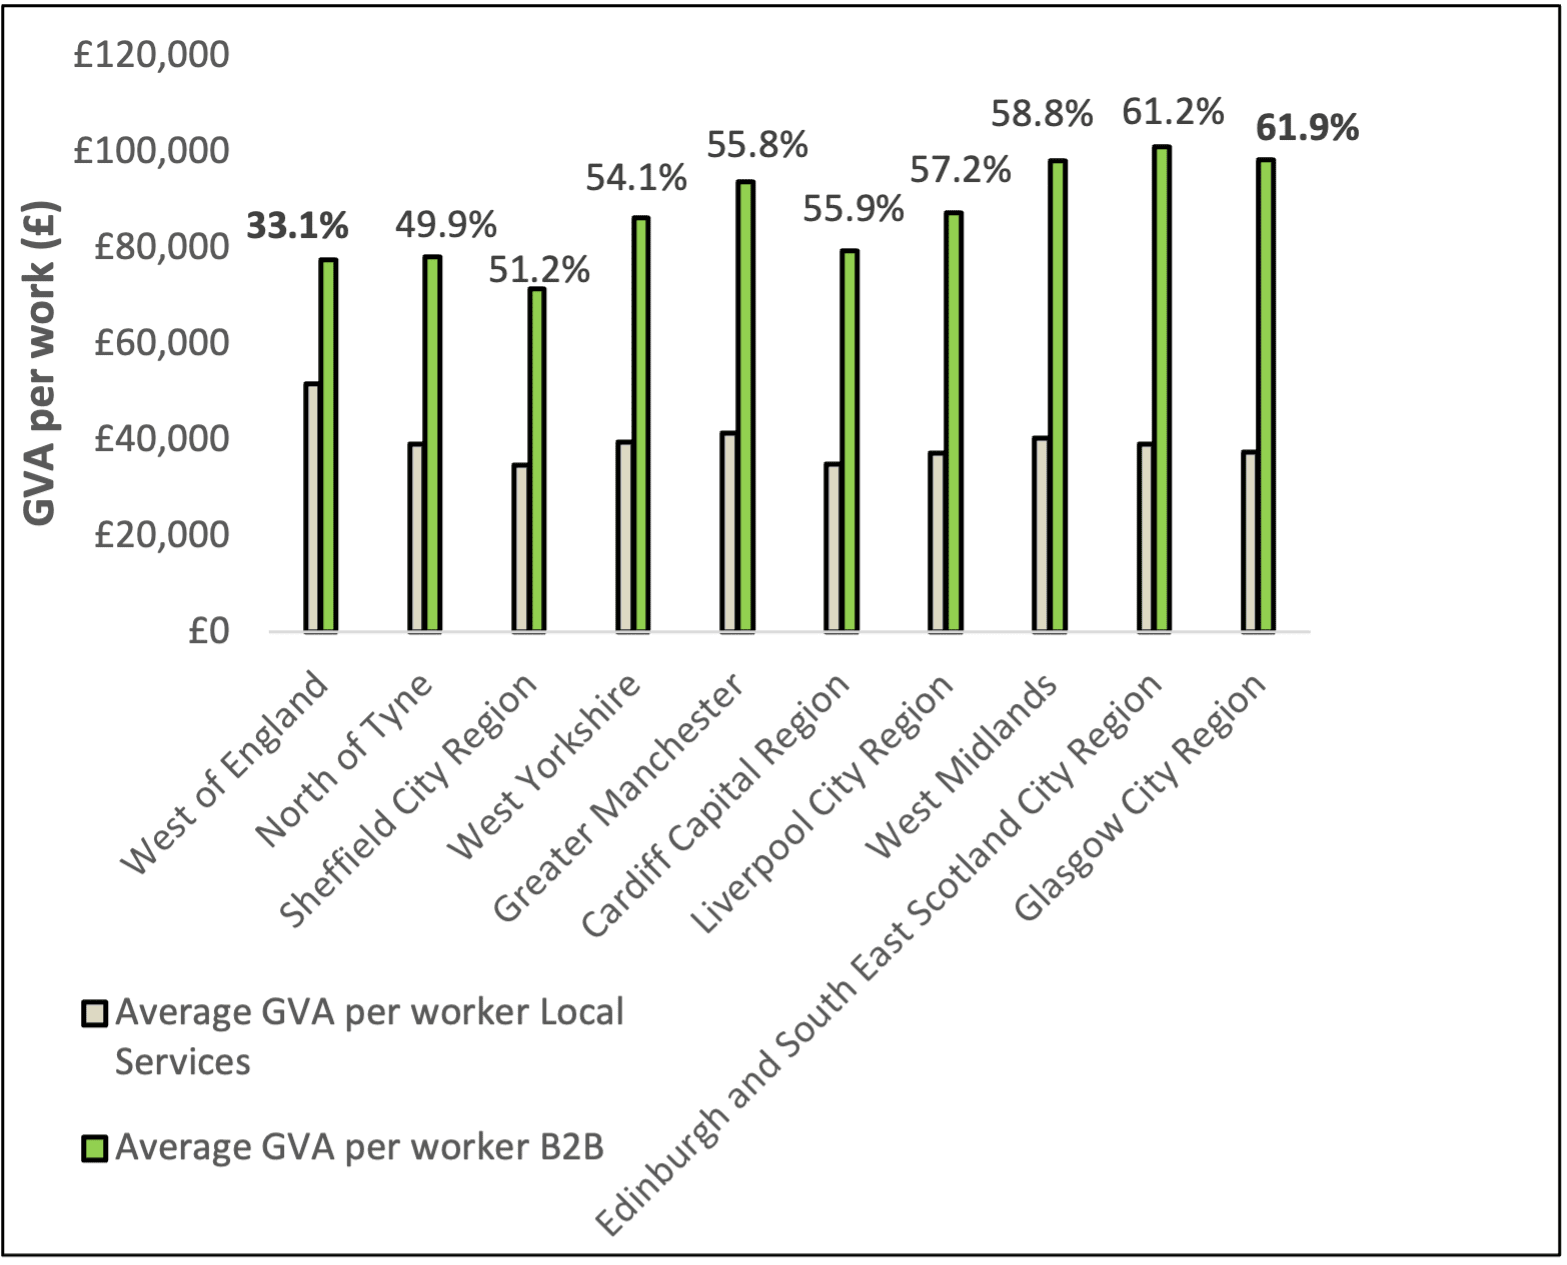
Our analysis suggests shows that the productivity gap between tradable sectors, and the foundational economy differs across the UK, and that polices aimed at increasing the productivity of the Foundational Economy could drive inclusive economic growth in GCR.
For instance, in West of England, tradable sectors are 33.1% more productive than Local Services, compared to GCR which has almost 2x the gap of 61.9%.
Improving productivity in GCR’s foundational economy to levels seen in West of England could increase total GVA generated by the Foundational economy by £9,500 million, or an increase of 20% to the value of goods and services produced by the entire Regional economy.
According to the Office of Budgetary Responsibility (OBR), the UK economy is now expected to grow by 0.6% in 2023, up from a contraction of 0.2% predicted in March 2023.
Economic Output: The UK’s total economic output looks unlikely to return to its pre-pandemic trend in the short / medium term.
Inflation Impacts: According to OBR forecasts, the UK economy proved more resilient to the shocks of the pandemic than anticipated. But, high inflation is increasing the costs of services and government debt.
Monthly real gross domestic product (GDP) is estimated to have grown by 0.2% in September 2023, following growth of 0.1% in August 2023.
The Consumer Prices Index (CPI) rose by 4.6% in 12 months to October 2023, dothewn from 6.7% in September.
Annual growth in regular pay was 7.7% in July to September 2023, this is slightly down on the previous periods but is among the highest annual growth rates since 2021.
Sources: ONS GDP, ONS Inflation, ONS Pay, PwC
Although inflation (CPI) has fallen to 4.6% over the last 12 months, food inflation is still high at 10.1%.
Beyond the widely covered narrative of easing inflation, estimates indicate that food inflation will likely end the year below 10%, almost 7x the rate seen before the pandemic.
Food inflation: has nearly halved from its peak of 19.2% in March 2023, which was the highest annual rate seen for over 45 years.
Household Spending: But, according to the ONS, more than 4 out of 10 adults surveyed are spending more than usual to buy food shopping. Other surveys ran by the ONS suggest that nearly half of the respondents were buying less food.
Living Standards are Falling: Despite record breaking real wage growth, the squeeze on families’ food and energy costs are causing a stagnation of disposable incomes, as suggested by the Resolution Foundation.
Sources: ONS, Resolution Foundation
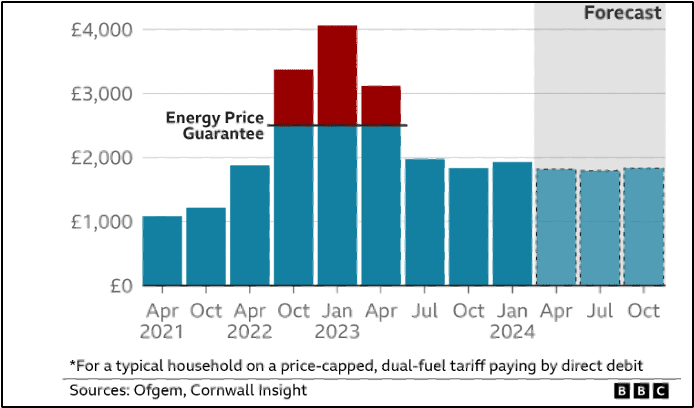
Energy price cap will rise in January, adding additional pressure on households
Ofgem’s UK energy price cap has been set to rise by 5% in January 2024, meaning that the typical annual household bill is projected to increase from £1,834 to £1,928, an increase of £94.
Price Cap: The £1,928 price cap set by Ofgem for January 2024 is substantially lower than £4,059 which was triggered by the initial invasion of Ukraine by Russia.
But, the price cap remains far higher than caps seen pre-pandemic caps, which were on average below £1,200.
Household impacts: The rise in energy costs comes at the same as recent research undertaken by the Resolution Foundation shows that average households will be around £1,900 poorer by January 2025 than they were in December 2019.
The Labour Force Survey release continues to be delayed due to concerns about its reliability from low response rates, but the latest data shows a similar trend of a weakened labour market.
Table 1: ONS Experimental Labour Market estimates from July to September 2023* Source: ONS
| Unemployment (%) | Unemployment (ppts) Quarter Change | Employment (%) | Employment (ppts) Quarter Change | Economic Inactivity (%) | Economic Inactivity (ppts) Quarter Change |
|---|---|---|---|---|---|
| 4.0 | 0 | 74.3 | +0.1 | 22.7 | 0 |
| 4.2 | 0 | 75.7 | 0 | 20.9 | 0 |
Labour Market: The latest experimental data shows little difference to last month, with the impression being that the labour market remains stagnant. However, positive signs comes from nominal wage growth, which remains very high and growing, with falling inflation giving a to boost real pay growth slightly.
According to the IFS, vacancies continues to ease, but remain far above pre-pandemic levels, suggesting that the labour market is improving compared to the last few months: This also suggests that rather than there being a slowdown of demand, there is less people moving jobs or leaving the labour market.
New Data Gathering Methods: UK and global indicators, like GDP, are beset with similar issues, with revisions to the post-pandemic UK GDP, but new methods are helping validity. Measuring the economy is an inexact science, but the ONS are responding by exploiting VAT data to calculate GDP, web scrapping data to measure inflation and using payroll data from HMRC to interpret employment rates to inform upcoming releases.
Source: Institute for Employment Studies *These estimates use an experimental dataset
The Autumn Statement arrives at a time when the UK tax burden remains at a 70 year high, whilst the UK potential for growth looks poor compared to others like the US and the Eurozone.
Fiscal Impacts: The high tax burden, alongside the poor economic growth seen in the UK, creates a difficult fiscal policy environment. Cutting taxes would impact already restrained and in demand public services, whilst increasing public services would require raising taxes
Deep-rooted Productivity Problem: But as reported widely, the UK’s productivity problem appears to be deep rooted and long standing, as suggested by the head of the Productivity Institute, Bart van Ark:
“Especially since the early 2010s, we have seen the UK economy increasingly firing on only one or two cylinders, notably productivity in IT manufacturing and services…”
Business Investment: UK business investment has stagnated since 2016, growing by only 4.6% compared to 32% in the US, and evidence suggests that the period of high interest rates has further deterred business investment.
UK’s weak productivity outlook has been widely reported this month, and our analysis suggests that increasing productivity in the Foundational Economy could help drive inclusive economic growth
Productivity Gap: Glasgow City Region has a comparably high GVA per worker in tradable sectors, but local services are typically less productive than seen in other UK Core City Regions.
For instance, in West of England, tradable sectors are 33.1% more productive than Local Services, compared to GCR, which has almost 2x the gap of 61.9%.
Economic Importance: Increasing the productivity of the foundational economy proportional to the gap in West of England could boost GVA generated by the foundational by around £9,500m, or boosting the GVA generated across the entire economy by almost 20%.
Inclusive Growth: According to the OECD, the UK currently spends more than anywhere else in Europe subsiding inequalities of income. The Foundational Economy has among the lowest pay, in areas like Hospitality and Social Care. Economic policies that increase the productivity of the Foundational Economy can not only deliver substantial economic growth, but can also boost wages and living standards for people that deliver essential services to local areas.
In the autumn statement, Chancellor Jeremy Hunt announced cuts to National Insurance, changes to the benefits system and support for business to drive investment.
The main rate of employee national insurance contributions will but cut from 12% to 10% from 6 January 2024:
The system of businesses being able to offset investments in IT equipment and machinery against tax will made permanent:
Highlighted by many like the Resolution Foundation, despite the proposed tax cuts, many lower earners are still paying relatively high amounts of income and national insurance tax from thresholds being frozen:
National Living Wage (NLW) has increased
Universal Credit will uprate using September’s inflation
Local housing allowance
State Pensions honour the triple lock
Mandatory work placements
Gross Domestic Product (GDP): The total monetary value of final good and services produced in a country in a given time period.
Consumer Price Index (CPI): Is a weighted-average of a basket of consumer goods and services purchased by households. Changes in measured CPI tracks changes in prices overtime.
Unemployment rate: Unemployed people are out of work but actively looking for a job and available to start work in the next two weeks. It is measured as the number of unemployed people divided by the number of economically active population (those in employment and those unemployed).
Economic Inactivity rate: Economically inactive people are out of work but are not actively looking for a job. The headline inactivity rate is calculated by dividing the inactivity level for those aged from 16 to 64 divided by the population for that age group.
Economic inactivity due to ill-health: Economically inactive people whose primary reason for being out of work is ill-health.
Enterprise Rate: Number of businesses per 10,000 of the working age population (16-64)
Inclusive Growth: The Scottish government defines it as, ‘growth that combines increased prosperity with greater equity; that creates opportunities for all; and distributes the dividends of increased prosperity fairly’
For queries and further information, please contact Will Harkiss: