Intelligence Hub

Economic Briefing January 2025

Executive Summary

As the UK marks National Productivity Week, attention turns to how city regions can stimulate economic growth and elevate quality of life through improved productivity. This discussion is especially relevant for Glasgow City Region (GCR), which has set an ambitious target: to become the most productive city region in the UK by 2030.

Productivity is a vital driver of societal advancement. By increasing productivity, regions can strengthen their economies, provide enhanced local services, and foster a higher quality of life for their communities.

This briefing note highlights the key insights from the Glasgow City Region Intelligence Hub’s latest research paper, which examines the productivity gap between Glasgow City Region and the West of England.

This note also reviews recent findings from the Economic Research Council (ERC) that are particularly relevant to policies aimed at supporting small businesses and the Regional Fair Work agenda.

Note: A Glossary of all the terms used in this report can be found at the end.

Introduction

New research by the Regional Intelligence Hub looks at the factors driving productivity differences between GCR and the West of England (WoE). The key findings are summarised in this briefing note.

  • GCR ranks joint second with Greater Manchester in terms of productivity below the top performing Core City Region – WoE.
  • Although the WoE is the best-performing UK Core City Region, its productivity remains slightly below the UK average and significantly behind London and Edinburgh.
  • GCR aims to become the most productive Core City Region by 2030 — a goal within reach. However, it is important to recognise that even achieving this milestone would still place GCR below the UK average and the top-performing city regions.

Chart 1: Gross Value Added Per Hour Worked (£), 2022

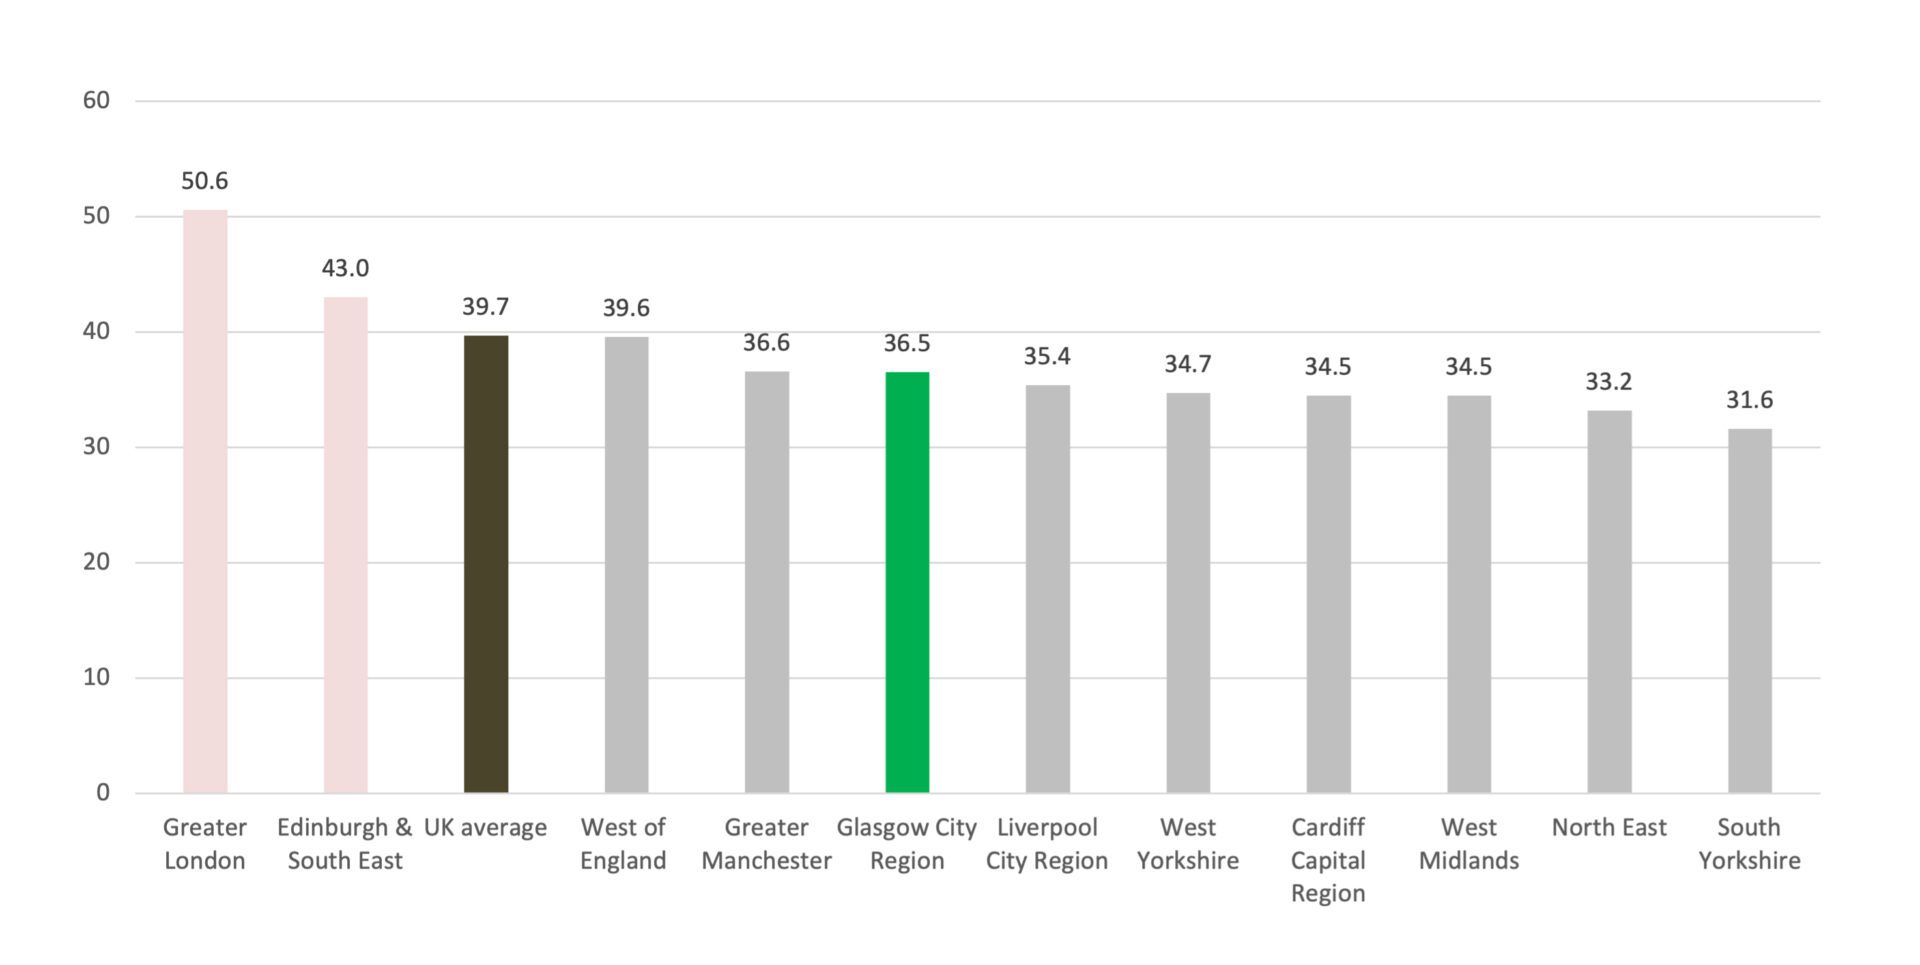
Source: ONS, Subregional Productivity statistics and BRES
*Note: Original chart has been edited to add Greater London, Edinburgh and UK average here for context

Key Results

The report considers the five key drivers of productivity. The analysis concludes that productivity differences are mainly due to differences in economic structure.

The paper explores various factors as potential drivers of productivity differences. It concludes that differences are mainly attributed to:

  • Different Economic Structure: The WoE’s higher concentration of industries in tradeable sectors and employment in knowledge-intensive occupations contributes to greater labour productivity.
  • Sectoral Performance Gaps: Poor performance of firms within some sectors such as Professional, Scientific and Technical Activities.

Key Drivers Explored

Key Results – Economic Structure

The disparity in the economic structure  between the two city regions may explain some variation in labour productivity. WoE places greater emphasis on high-tech and knowledge-intensive tradeable sectors, while GCR has a stronger focus on the Foundational Economy, such as hospitality and retail.

  • WoE has the highest share of firms in tradeable sectors (28.6%) of all UK Core City Regions while GCR has the fourth lowest (22.6%).
  • GCR’s economy has a stronger focus on the Foundational Economy
  • Moreover, the growth of jobs in knowledge-intensive business services (KIBS) in GCR has not kept pace with the WoE.
  • Over the period 2015-2022, the share of employment in KIBS in GCR has been approximately 17% compared to 24% in the WoE.

Chart 2: Tradeable Businesses as % of Total Business Base, 2023

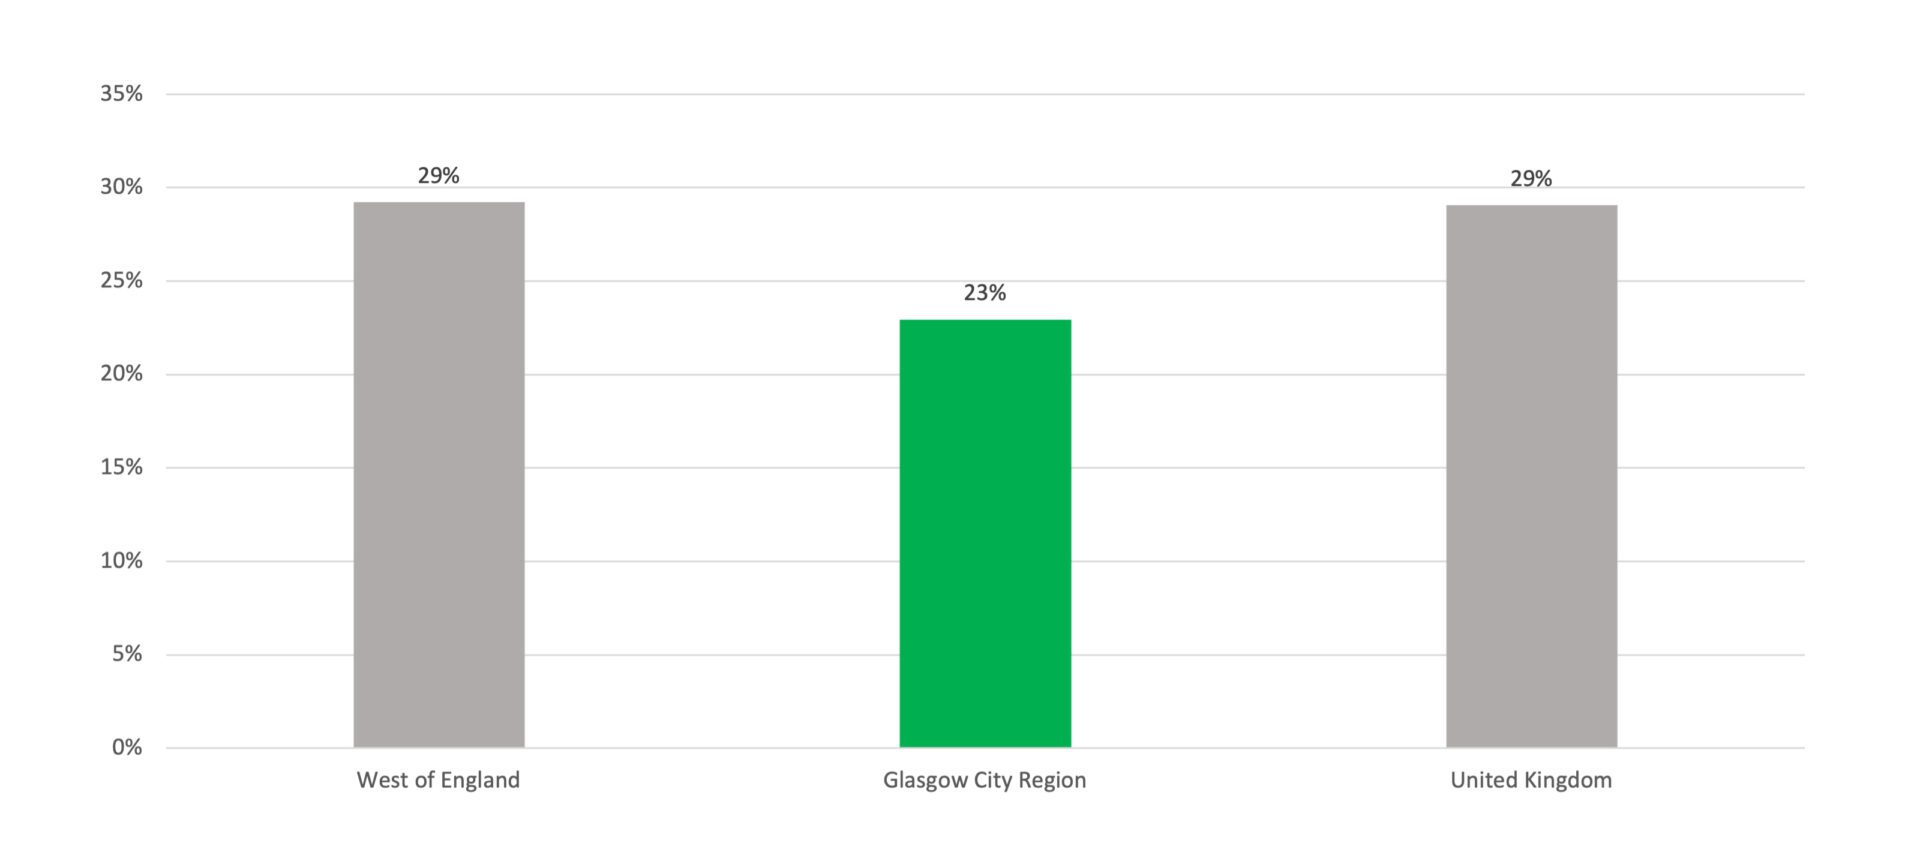
Source: UK Business Count, 2023

Key Results – Within Industry Productivity

Productivity differences are driven by poor performance of some service-related sectors. The most stark difference is in Professional, Scientific and Technical Activities.

  • An important element in understanding aggregate labour productivity differences between regions is to look at industry productivity differences.
  • This means that firm productivity in one area can differ from those in the same industry in other areas.
  • Productivity differences are driven by differences in average labour productivity of service-related sectors.

Chart 3: Average Labour Productivity by Sector, 2021 (excl. Primary Industries, Financial Services and Real Estate)

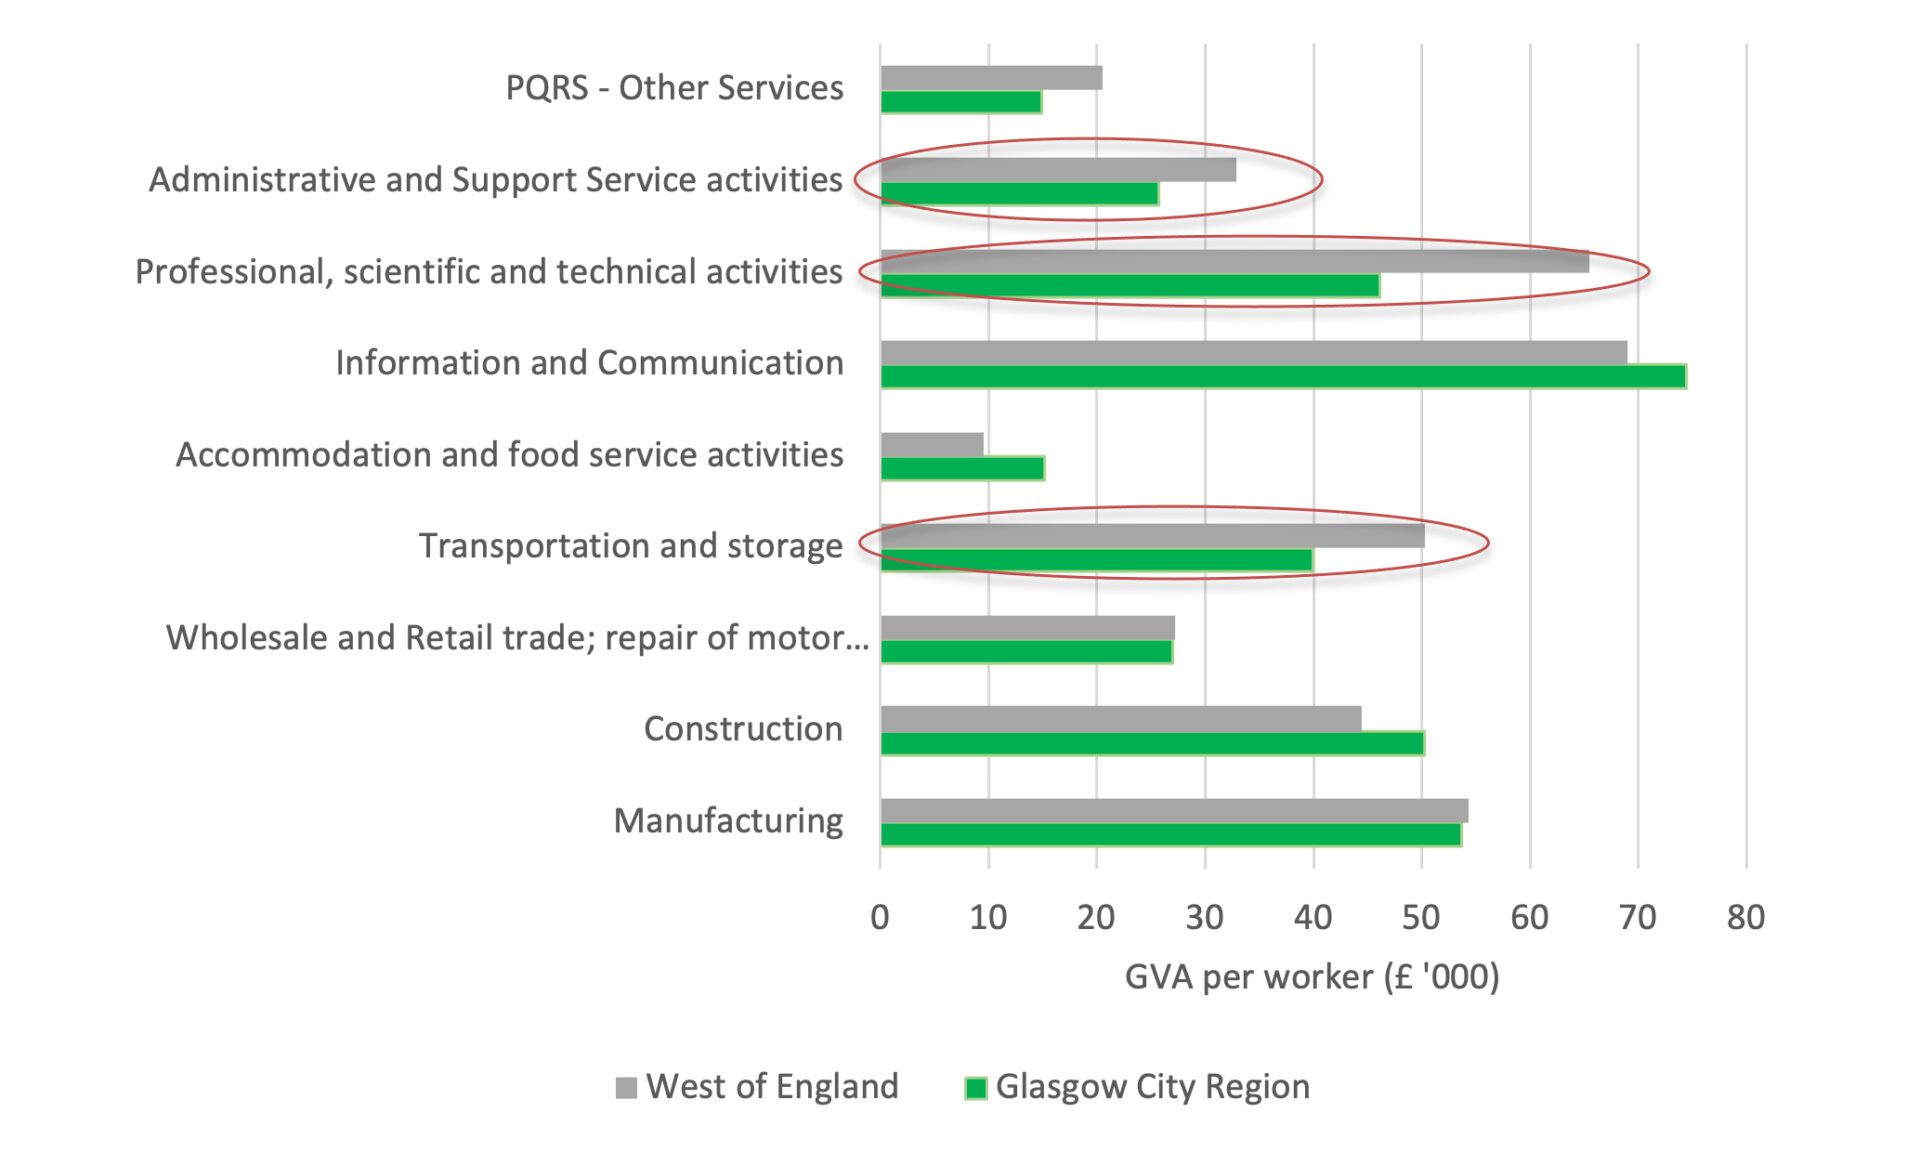
Source: Firm-level productivity distributions for Selected City Regions from the Annual Business Survey, ONS

Factors Contributing To Lower Labour Productivity

The paper looks at some key factors that are driving these productivity differences between sectors such as innovation, investment, skills and health.

    • R&D and Innovation: WoE invests significantly more in R&D and commercialisation compared to Glasgow, which has a relatively strong innovation ecosystem but struggles with converting research into productivity improvements.
    • Investment Performance: Glasgow’s gross investment rate is comparable to WoE suggesting an effective investment ecosystem. However, challenges remain in attracting targeted investments that support growth in key sectors.
    • Skills: GCR has a highly skilled workforce but faces skills shortages in emerging sectors, which limit productivity.
    • Health Challenges: GCR has the highest proportion of economically inactive individuals due to ill health, presenting a unique barrier to economic productivity.

Chart 4: Average Gross Investment Rate (2010-2020)

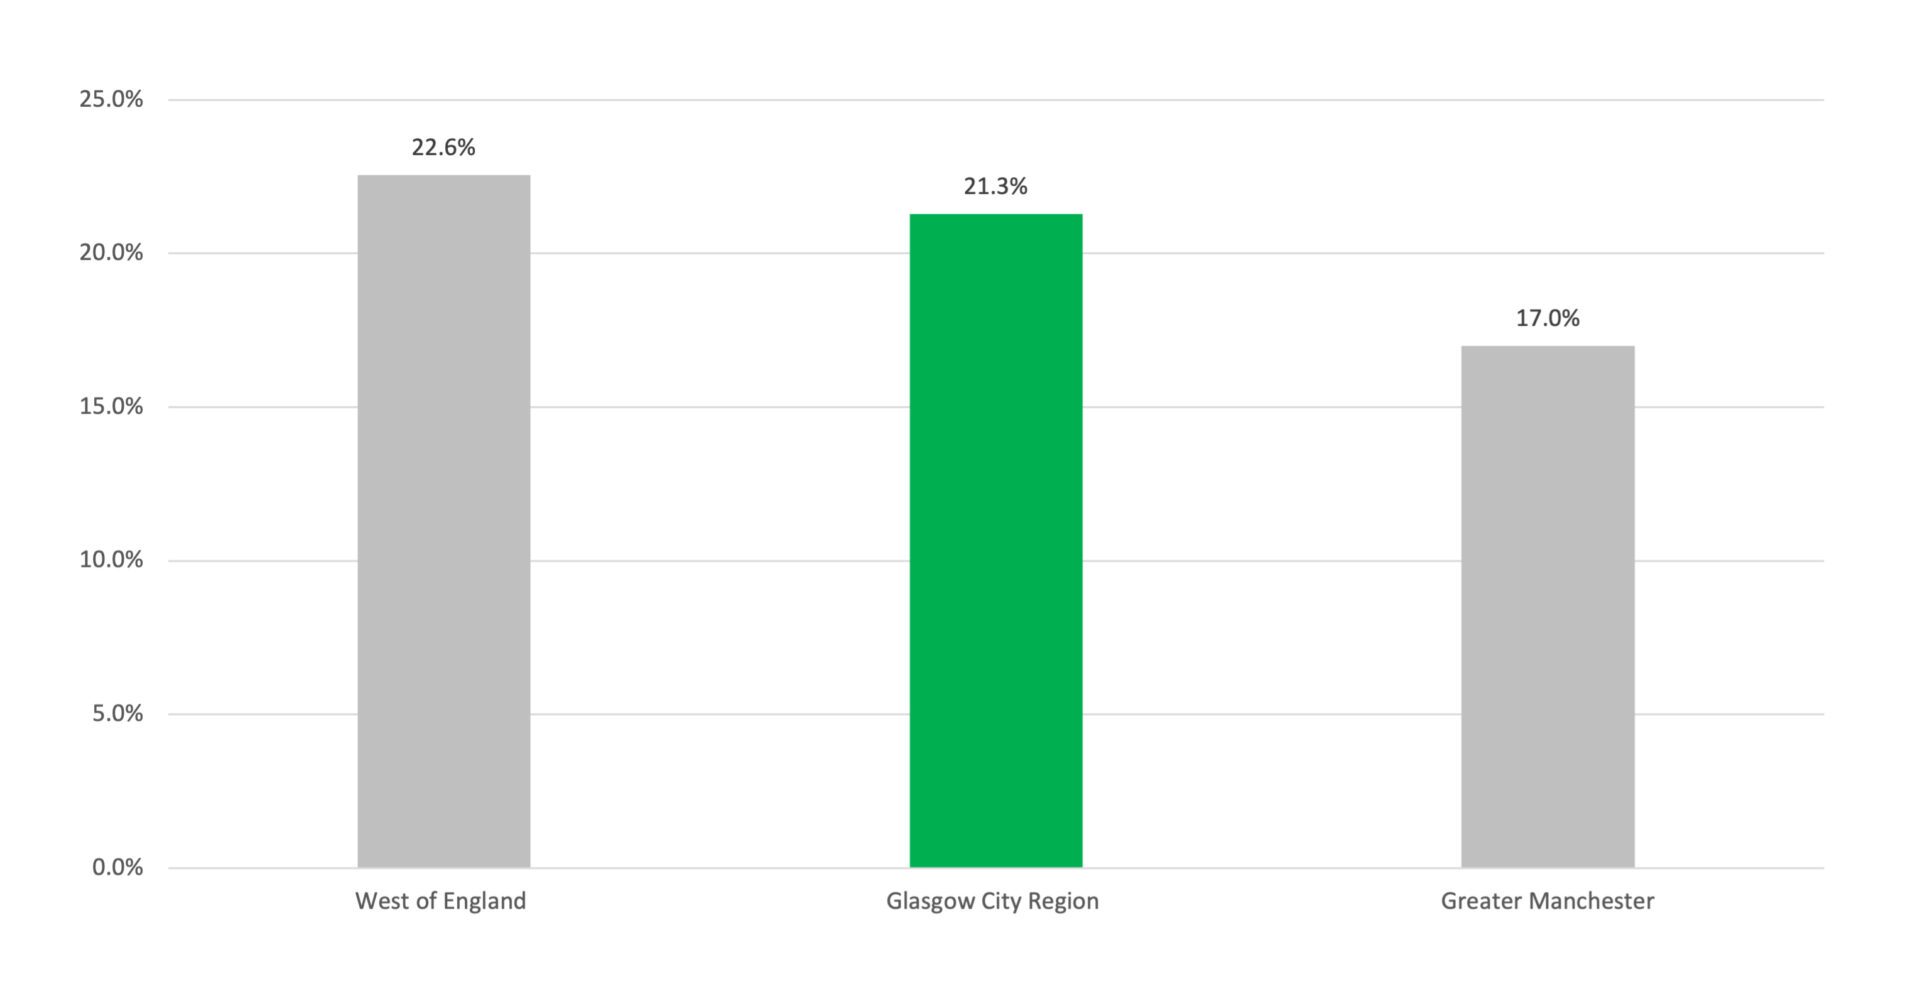
Source: Intelligence Hub analysis of ONS experimental gross fixed capital formation (GFCF) estimates by asset type, all industries.

Policy Implications

The paper suggests that GCR shouldn’t try to replicate WoE’s economy but instead draw lessons to address weaknesses that make GCR less attractive to investors. Skills development and infrastructure should be at the core of this policy.

  • Attracting and nurturing high-performing firms in tradeable sectors to drive growth and competitiveness.
  • This will depend on the benefits if offers to investors such as skilled labour, an effective innovation ecosystem and suitable infrastructure (i.e. dense city centre, good connectivity, commercial space).
  • In addition to driving productivity in the tradeable sectors, there is a critical need to boost productivity in the GCR Foundational Economy such as Retail.
  • Recent research shows that boosting productivity in low-wage sectors could increase GVA and improve outcomes for the poorest households, creating a more inclusive economy.
  • Affordable Housing: A potential downside is increased pressure on affordable housing, raising the question of whether housing supply can keep pace with a growing workforce, over and above current trends.
  • Gentrification and Displacement: Additionally, the impact of increases in land values which results in gentrification and displacement should also be taken into consideration.
  • Examples from Successful Cities: Edinburgh and Manchester have both faced challenges in balancing growth with affordable housing.
  • In Edinburgh, rising demand from students and professionals has tightened the rental market, while Manchester’s regeneration often prioritises higher-income housing, leaving low-income groups struggling.

The Impact of Flexible Work on SME Performance in Scotland

New research from the Enterprise Research Centre shows the impact of flexible work arrangements (FWA) on SME performance in Scotland. The key findings and policy implications for the Region are summarised below.

Key Findings:

  • Widespread but Uneven FWA Adoption: Three-quarters of Scottish SMEs offer FWAs, with flexitime being the most common, but adoption varies by sector, size, and location.
  • Sectoral and Firm Size Differences: Sectors like hospitality and education favour specific FWAs, while smaller firms rely more on zero-hours contracts than medium-sized firms.
  • Innovation Boost: Firms with FWAs, especially flexitime, are more likely to innovate, linking flexibility to creativity and competitiveness.
  • Policy and Data Gaps: Despite the benefits of FWAs, their link to labour productivity is not statistically significant. Improved data and tailored policies are needed to address small firm challenges and fully leverage FWAs’ potential for productivity and innovation.

Policy Implications

  • Promote FWAs for Innovation and Inclusivity: Awareness campaigns and resources should highlight FWAs’ benefits for fostering innovation, talent attraction, and retention, particularly targeting smaller firms.
  • Sector-Specific Policies: Tailored policies should address sectoral challenges, such as ensuring fair conditions for workers in hospitality and healthcare while promoting stable employment and flexibility.
  • Place-Based Approaches: Policies should consider local economic and labour market conditions, addressing barriers like childcare, housing, and transport to enable FWAs adoption.

Key Lessons From The 2024 ERC State of Small Business Britain Conference

The 2024 ERC State of Small Business Britain Conference focused on improving support for small firms amid economic challenges, emphasising the need to address fragmented support, design tailored programmes, and boost leadership capabilities.

Persistent Challenges

  • Inclusivity and Scaling: Despite high start-up rates, many businesses remain necessity-driven and fail to scale, with barriers like gender inequities persisting.
  • Productivity Puzzle: Longstanding productivity gaps require targeted investment and better support for firms embracing digital and innovative practices. Many firms associate productivity with efficiency or pricing rather than value-added outcomes. Changing this mindset is a key challenge.
  • Declining Innovation Rates: Despite substantial innovation funding, small firms are retreating from product innovation, focusing instead on service innovation.
  • Fragmented Support: Access to business support remains inconsistent, making it hard for small businesses to navigate. A cohesive, easy-to-access “front door” for business support is essential to streamline access and reduce confusion.

Policy Implications

  • Proactive Engagement: Use government and commercial data to identify key moments in a business’s journey (e.g., exporting or scaling up) and offer timely, relevant support.
  • User-Centric Design: Support programmes must reflect what SMEs actually need, not just what policymakers assume they want. Building trust and reducing opportunity costs for business owners (e.g., time spent on support programmes) are vital.
  • Trusted Advisers: Relationships of trust between businesses and skilled advisers are key. Business leaders are more likely to act on advice when they believe in its value and relevance to their challenges.
  • Focus on Early Stages: Establishing relationships early and capitalising on challenge points can encourage sustained use of support.

Glossary

GVA per hour worked: is a measure of labour productivity that calculates the amount of economic output produced per hour worked. It’s calculated by dividing the total GVA by the total number of hours worked.

GVA per worker: measures the contribution to the economy of each individual worker. This measure allows for comparisons across industries and city regions.

Tradeable sectors: A tradable sector is a part of an economy that produces goods and services that can be sold and consumed outside of the country such as cars and computer software.

Foundational Economy: Is an evolving approach to socioeconomic development which focusses on the provision of everyday universal basics like food and housing.

Gross Investment Rate: This is a common measure of public investment. It is the total amount of money spent on new capital. It’s also known as gross fixed capital formation (GFCF).

Contact

For queries, please contact Christina Kopanou:
Christina.kopanou@glasgow.gov.uk

Further Information

For queries and further information, please contact Will Harkiss:

william.harkiss@glasgow.gov.uk