Economic Briefing April 2024
Economic Outlook: The UK economy is showing continued resilience as it progresses into 2024. Inflation reduced to 3.2% in March 2024, contributing to improved consumer spend and sentiment. But sectors like construction continue to experience declines in output, and business investment intentions remain tepid, influenced by past economic uncertainties and current cost pressures.
Inflationary Trends: Although UK inflation fell in March, it remains an outlier compared to the US and the Eurozone. Also, while UK Goods (cost of tangible products and goods) inflation has fallen since June 2023, Services (cost of intangible services) inflation has risen. This may show the changing nature of inflationary pressures on business. With National Minimum Wage increases and issues of retaining and hiring staff increasing costs for Regional firms in hospitality and retail.
National Minimum Wage: Alongside the positive impact on workers, recent evidence from business suggests that increases in staffing costs have the potential to increase productivity and staff retention. Others have suggested that it is impacting pricing competitiveness, as they weigh up increasing costs and cutting staff in response.
Spotlight on Economic Inactivity and Inclusivity:
Economic inactivity due to long-term sickness in Glasgow City Region (GCR) has decreased over the past year, according to recent data from the Annual Population Survey. However, overall economic inactivity increased during the same period, while the UK Core City Region average decreased.
The biggest contributing factor to the increases in economic inactivity was due to those looking after family – with GCR seeing the largest percentage point increase among UK Core City Regions.
Learnings from Greater Manchester show the positives of taking a holistic approach to employment support. This includes considering health and discrimination to help formulate policy responses that help people into healthy work.
The outlook continues to improve, with inflation falling and indicators like the Scottish Consumer Sentiment increasing.
The UK economy continues to show signs of improvement in recent months.
Consumer confidence in Scotland is on an upward trend, shown in the Scottish Consumer Sentiment Indicator which improved for a second consecutive month in February. This marks a significant enhancement over the past year and may lead to increased demand for Regional firms. This boost in consumer sentiment is likely influenced by a notable reduction in inflation, which decreased to 3.2% in March 2024.
Despite positive developments, challenges remain:
But, as these pressures stabilise and financial conditions potentially improve, there may be improved growth in business investments throughout and further into the year.
Real Gross Domestic Product (GDP) grew by 0.1% in February 2024, following a growth of 0.3% which was revised up from 0.2%
The Consumer Prices Index rose by 3.2% in March 2024, down from 3.4% in February. Continued easing of Food Inflation has been a key factor.
Annual Growth in regular earnings was 6%, and the annual growth in average total earnings was 5.6%.
Sources: ONS GDP, ONS Inflation, ONS Pay, Scot Gov
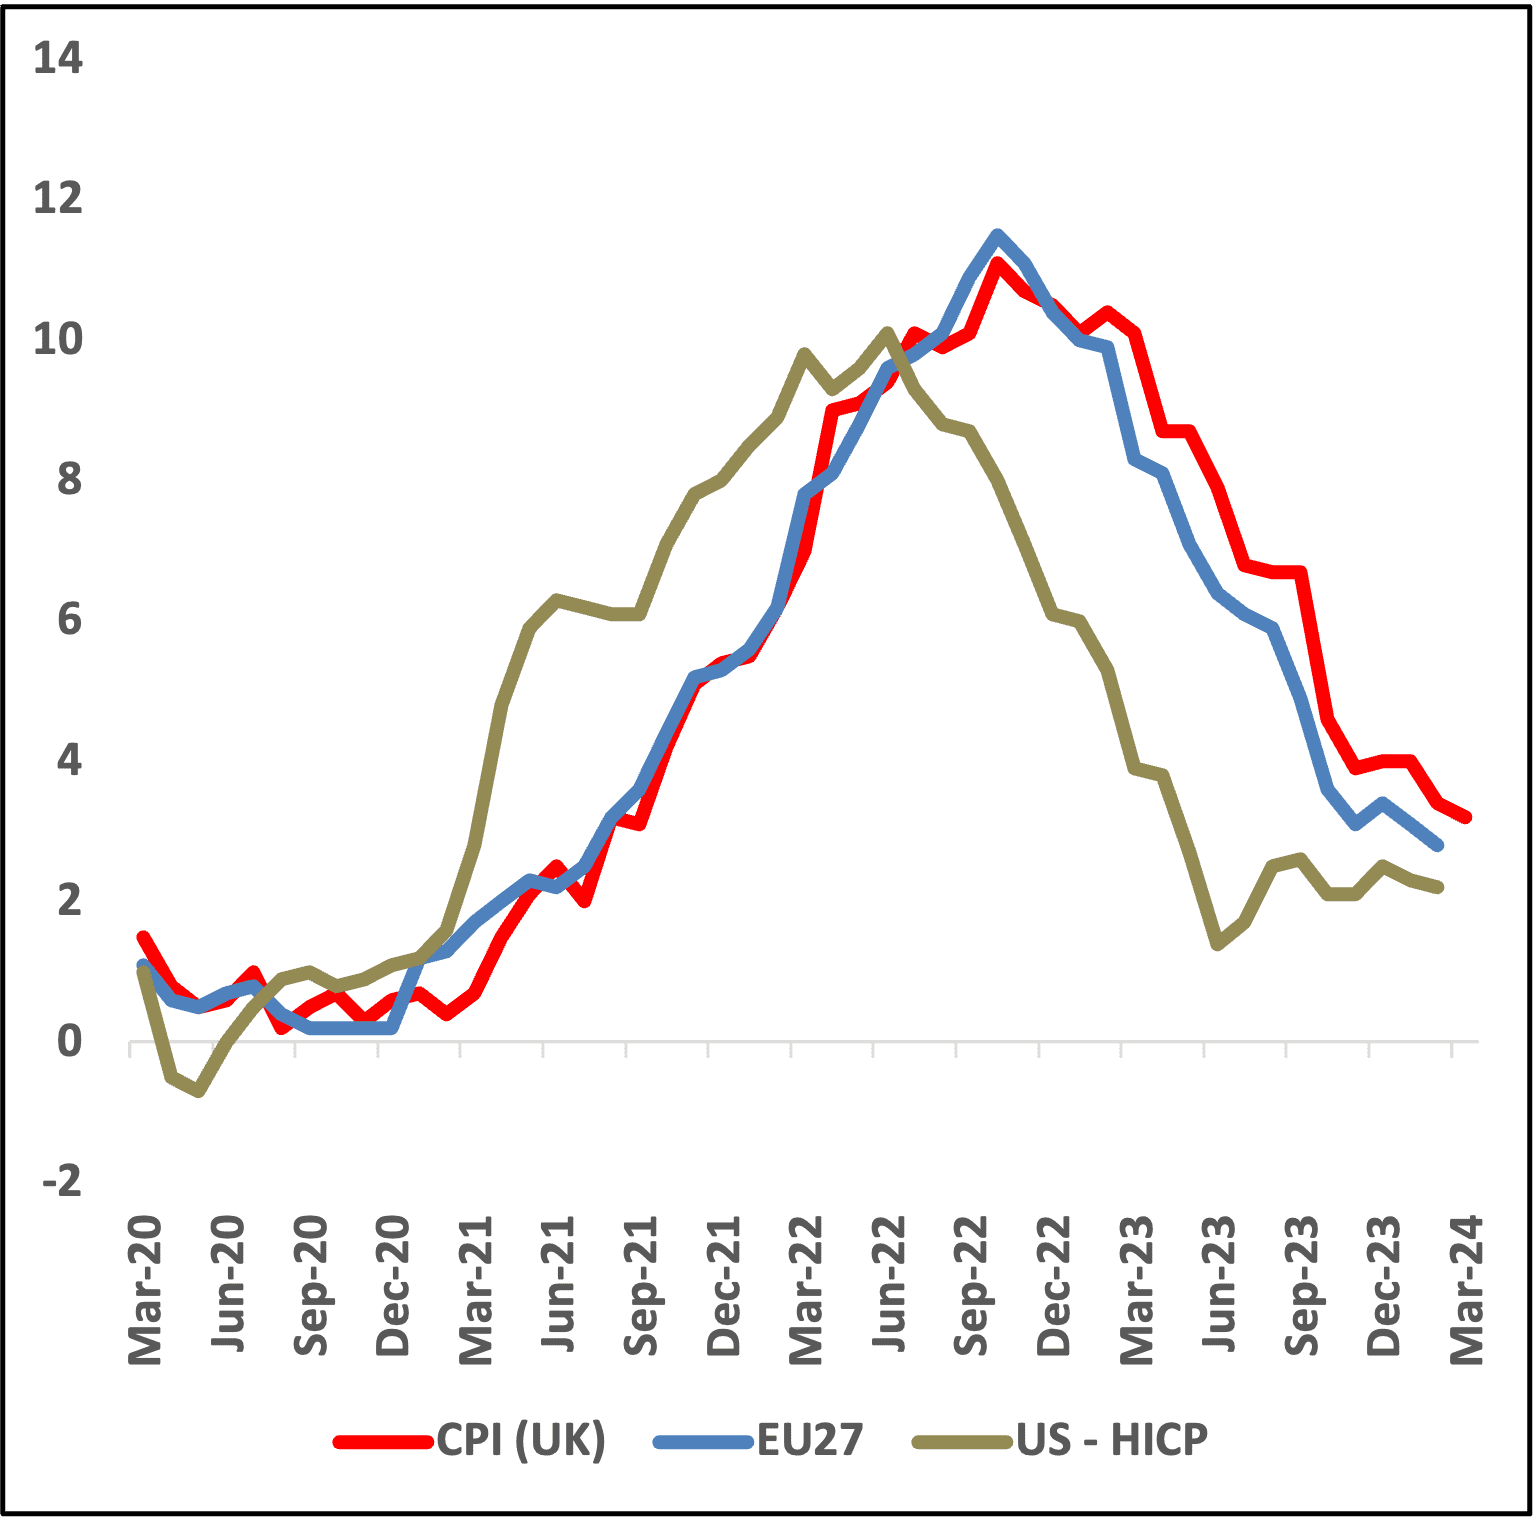
Despite Cooling, UK Inflation Remains Higher than Comparators Like the US and the Eurozone
The UK’s sectoral profile, coupled with Brexit, is creating problems for taming inflation.
According to Bank of England policy makers, the UK economy has significant structural issues which will lead to the UK’s inflation remaining higher long term.
All three economies were shocked by the COVID-19 pandemic’s supply chain issues, and the consequent energy crisis. But analysis from Bangor University suggests that the scale of the financial sector in the UK compared to others may be creating issues in taming inflation.
They argue that rising interest rates is a blunt tool to combat inflation. This is because
it make its more expensive to repay debts, which in turn weighs down the finance sector’s turnover and productivity in the National economy.
This mixed with Brexit, reduced European immigration and increased costs for trade with Europe, means that it has become harder to stop higher costs for doing businesses being passed onto the consumer.
Sources: Bangor University, ONS
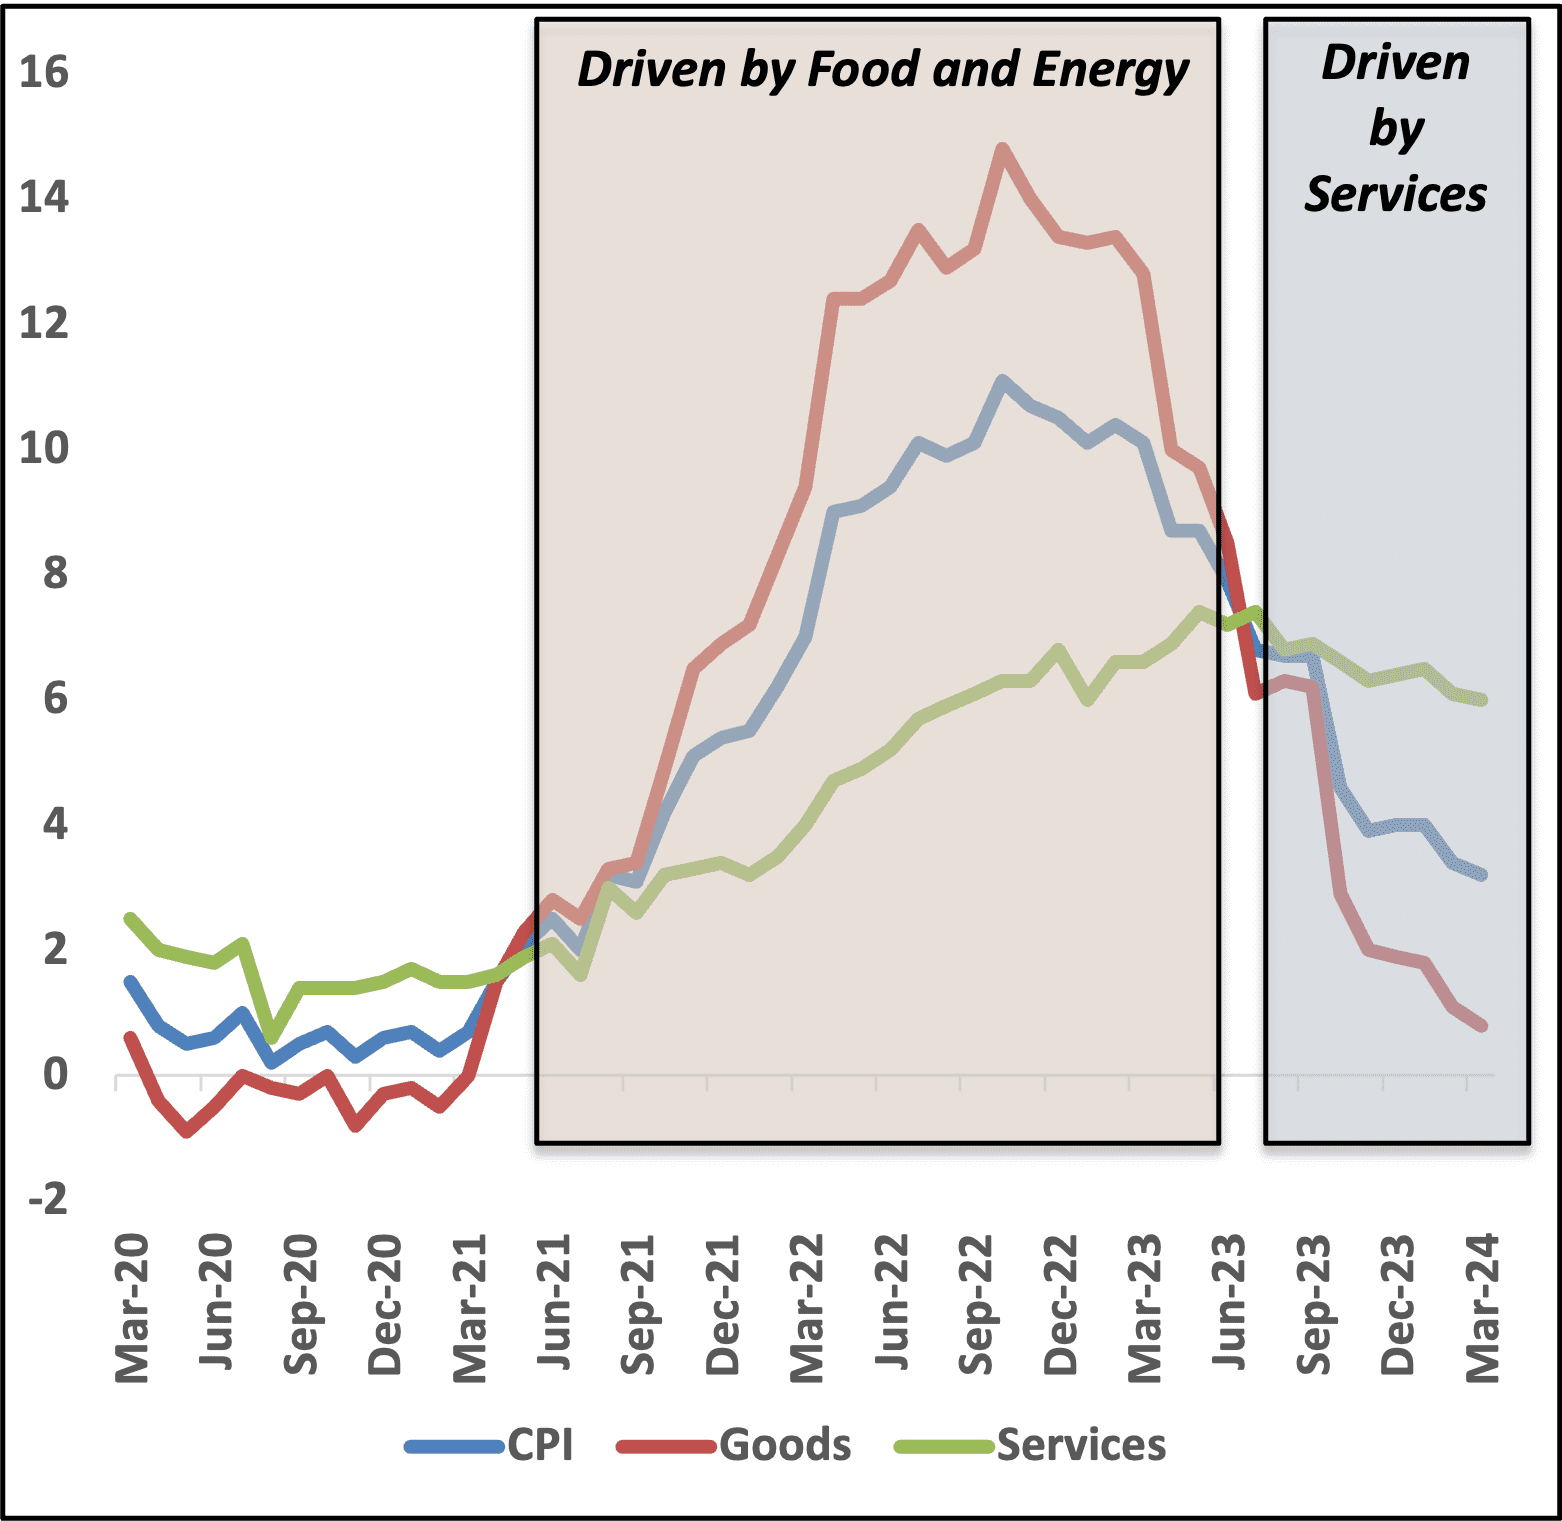
Increasing Costs For Services May Be Keeping the UK’s Inflation Rate Higher
Services are now the main contributor to inflation, as costs on goods and energy ease.
The initial increase in inflation was largely influenced by global factors – like increased demand for domestic goods, disruptions in supply chains, and significant rises in energy and fuel prices, driven by Russia’s full-scale invasion of Ukraine in February 2022.
But inflation can affect goods and services differently. Goods inflation refers to price increases in tangible products, like food, clothing, and electronics. This type of inflation can be influenced by changes in raw material costs, manufacturing processes, and import prices. Services inflation, on the other hand, involves intangible offerings such as healthcare, education, and professional services. It is often driven by wage growth, productivity levels, and service demand. Services require more human labour, so services inflation can be more persistent and less responsive to economic policy changes than goods inflation.
Since June 2023, Services inflation has contributed more to inflation than goods. Perhaps showing the impact of increasing economic inactivity, impacts of Brexit and the recent increases in National Minimum Wage on inflation.
Latest data shows weakened labour market in the UK but suggests stronger performance in Scotland.
Table 1: ONS Experimental Labour Market estimates from December to February 2024*
Source: ONS
| Unemployment (%) | Unemployment (ppts) Quarter Change | Employment (%) | Employment (ppts) Quarter Change | Economic Inactivity (%) | Economic Inactivity (ppts) Quarter Change |
|---|---|---|---|---|---|
| 4.0 | -0.4 | 74.2 | 0.5 | 22.6 | -0.2 |
| 4.2 | 0.3 | 74.5 | -0.5 | 22.2 | 0.3 |
Despite Scotland seeing a higher increase in employment during the last quarter, over the last year it has seen a larger reduction than the UK, falling from 75.1% to 74.2%. At a UK level, this fell from 75.2% to 74.5%, the largest annual fall since 2020-2021. Economic inactivity also rose from 21.6% to 22.2% (the highest rate since 2015).
The Institute for Employment Studies (IES) suggests that these trends can be explained by three main factors: fewer young people in work, more older people out of work, and larger rates of economic inactivity due to long-term sickness. Across the UK the number of people economically inactive (16-64) has risen by around 850,000 since before the pandemic. The IES has shown that over the last year, the UK has seen a strong growth in inactivity among people aged under 25.
A reduction in vacancies shows a greater degree of slack in the labour market. There are now 390,000 less vacancies than there were at the peak in early 2022. Looking at individual sectors shows that vacancies remain far and above pre-pandemic levels, with the notable exception of Retail showing lowered demand since 2019, with around 16,000 less vacancies than seen in early 2020.
Source: Institute for Employment Studies *These estimates use an experimental dataset
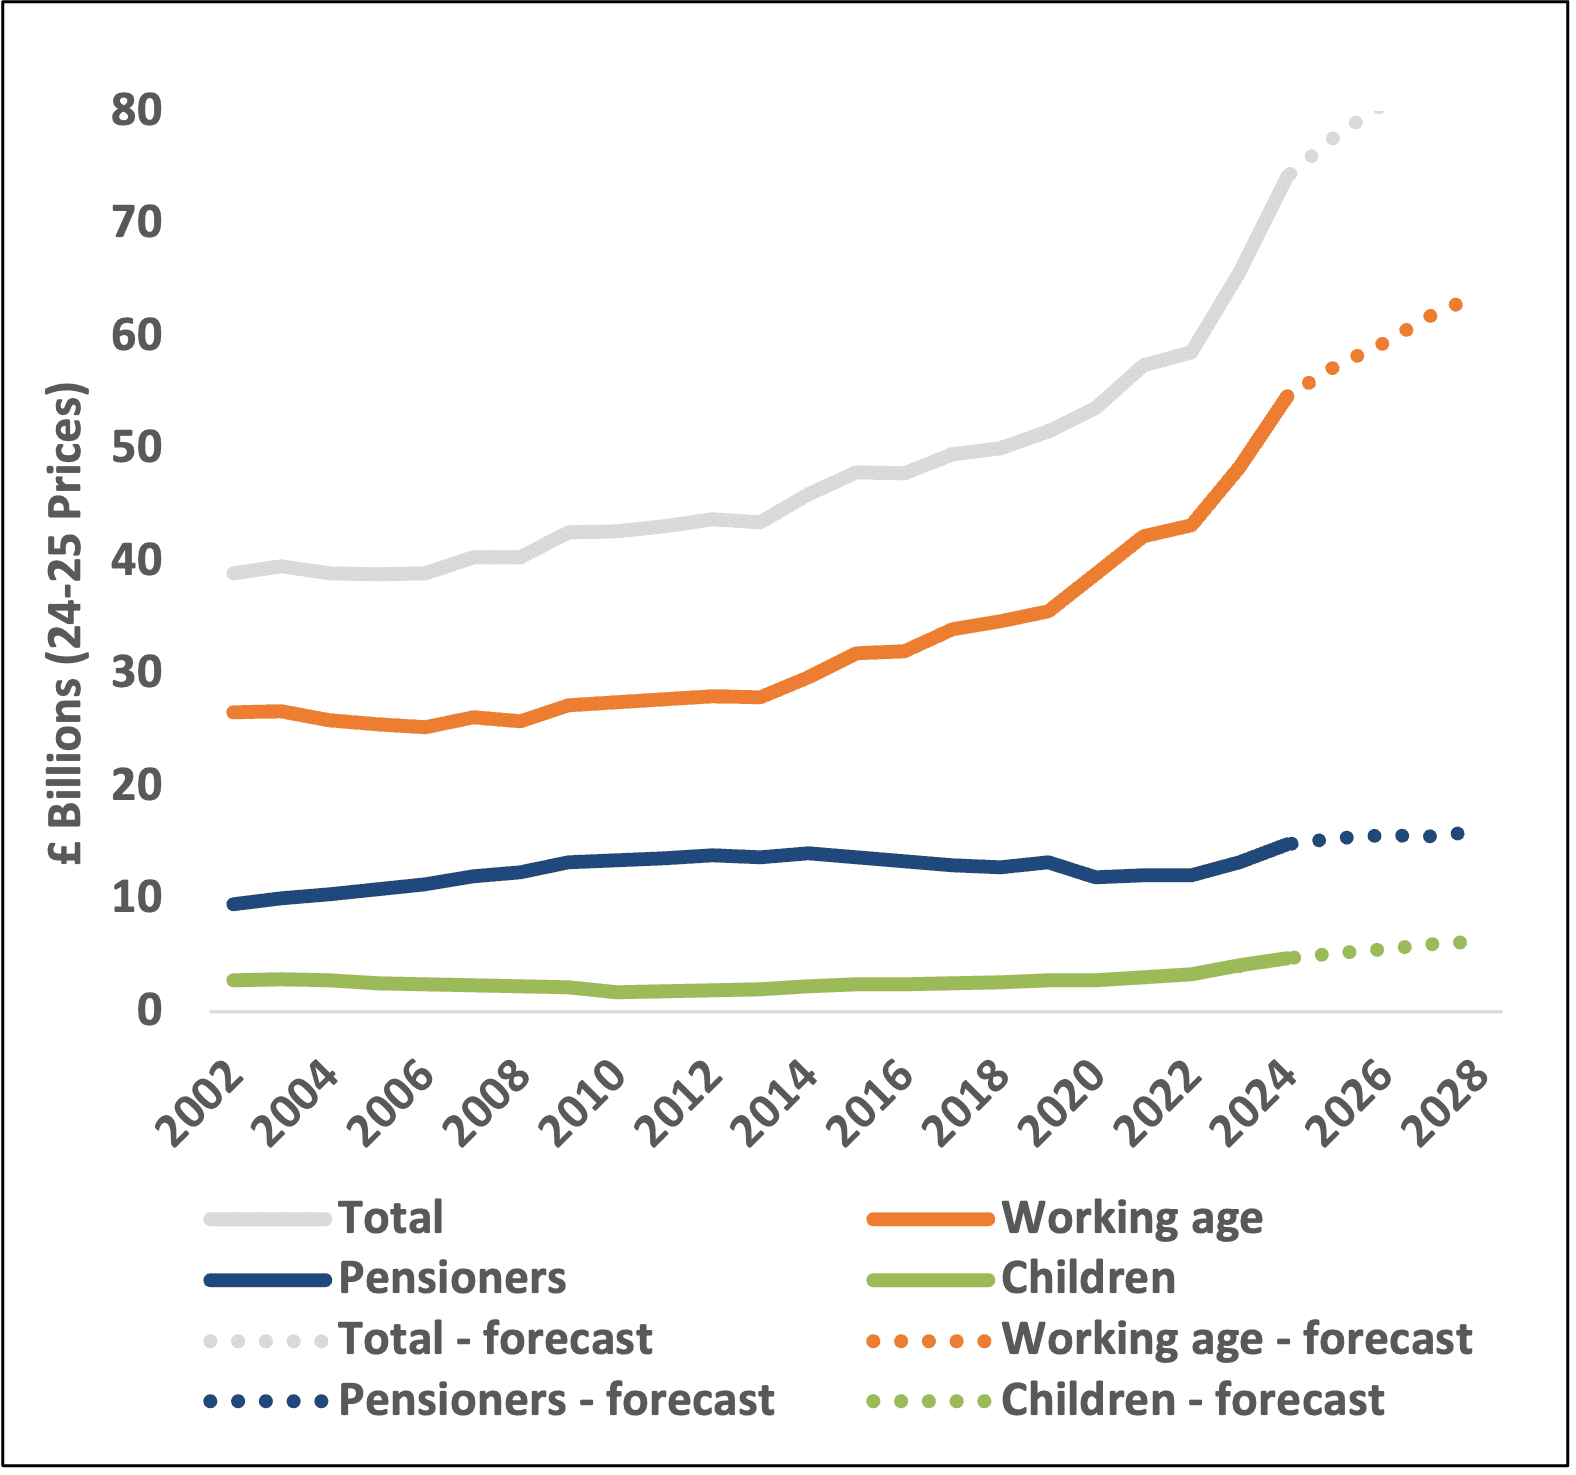
The pandemic had a profound impact on economic inactivity of working age people across the UK.
Economic inactivity due to long-term sickness has been widely covered this month. The pandemic had a profound impact, with around 10.2% of the UK working age population now in receipt of health-related benefits, up from 7.9% in 2019.
This can significantly reduce the size of the active workforce, impacting productivity and labour supplies. At the same time, it can also increase dependency on and the cost of health services and social benefits. Institute for Fiscal Studies (IFS) analysis showed that the continued rises in working-age caseload would see total spend reach £86 million in 2028-29, a 67% increase since 2019-20 across the UK.
Analysis from the US shows that falling real incomes against high inflation pushed more people to apply for health-related benefits. The OBR’s November forecast took this into account when forecasting caseloads, believing improvements in the economy would reduce numbers applying. Unsurprisingly, research suggests that improving economic opportunities can, in part, help to address economic inactivity.
Sources: Intelligence Hub analysis of APS, IFS
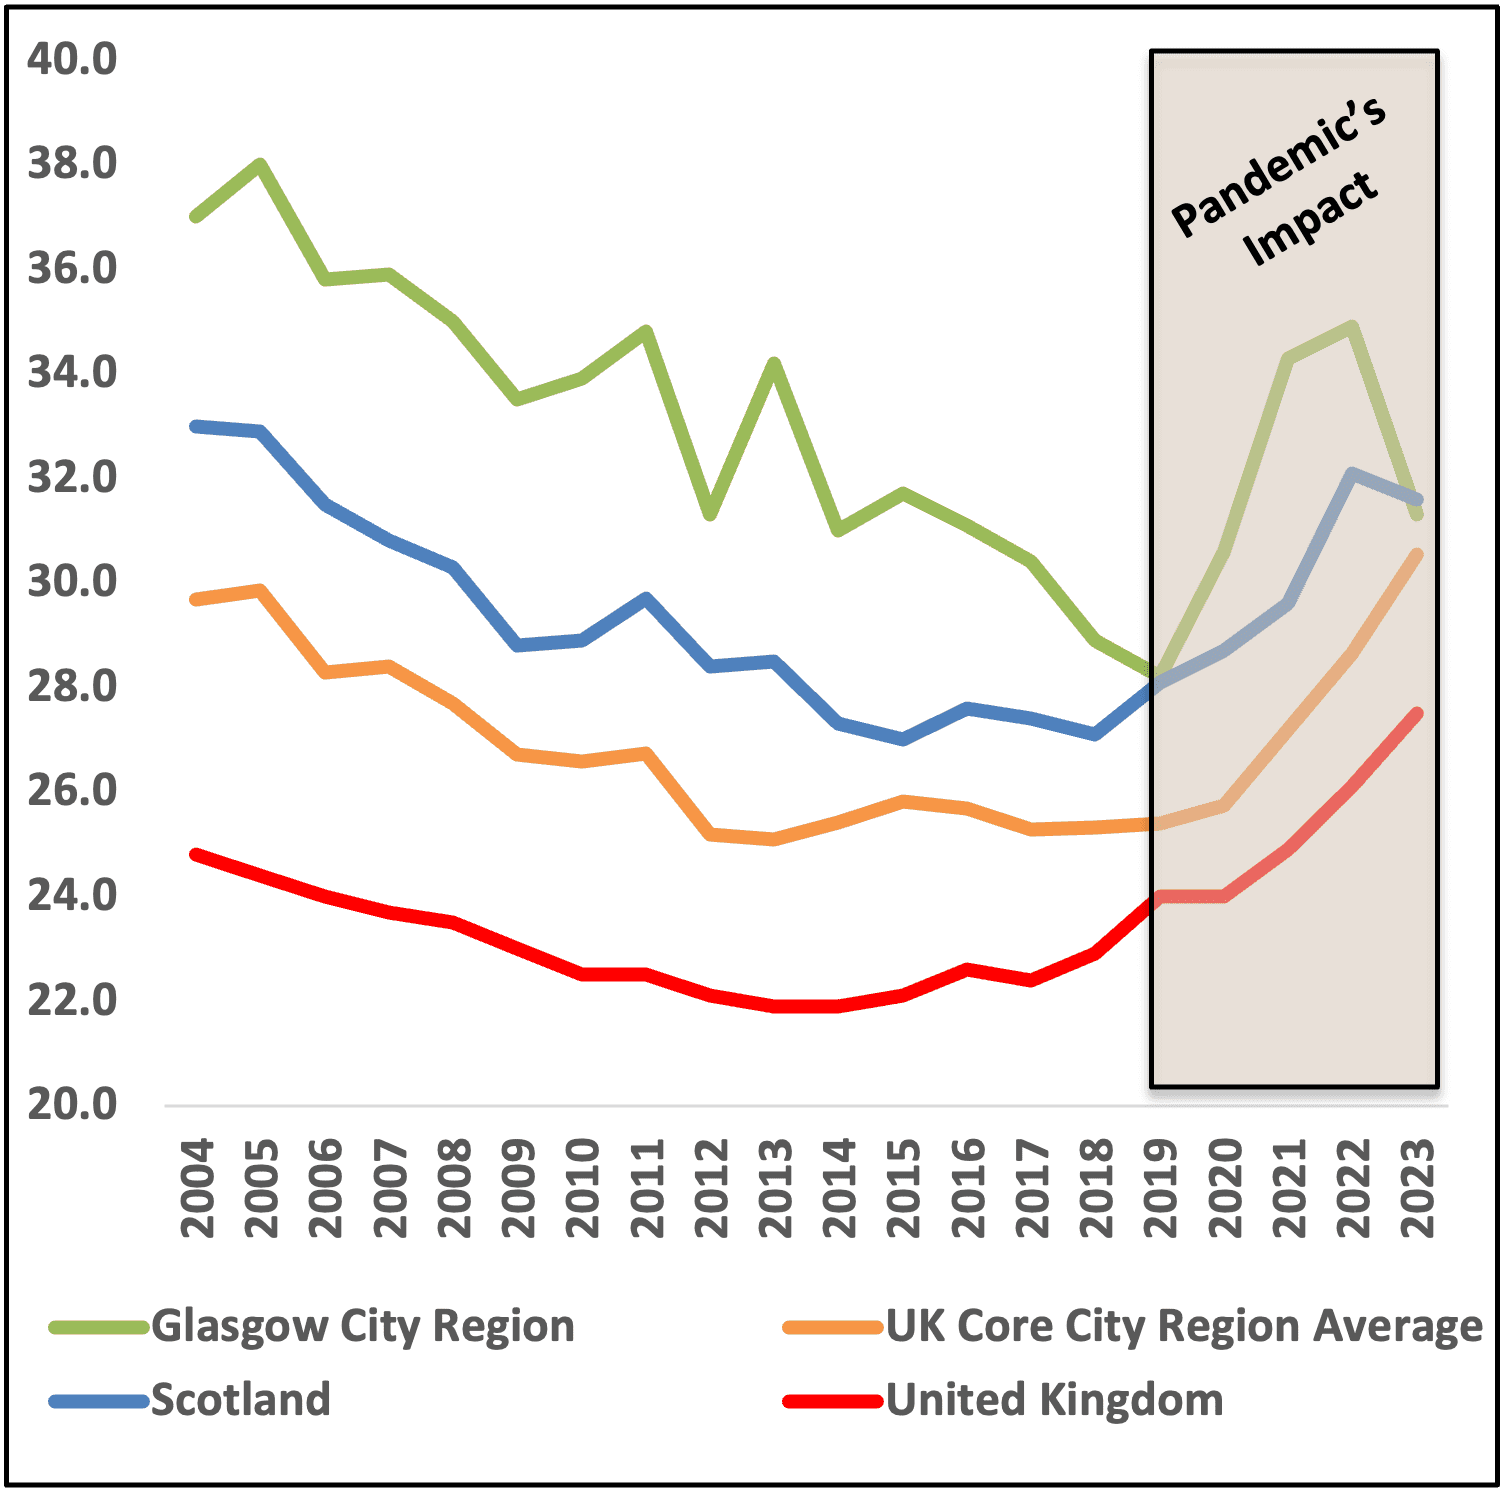
Despite peaking during the pandemic, the latest Annual Population Survey (APS) data illustrates a reduction in health-related economic inactivity for GCR.
According to the latest APS, with recent falls in rates, GCR now has a lower proportion of its economic inactivity due to long-term sickness than the Scottish average.
However, GCR still has higher numbers of economically inactive individuals due to long-term sickness compared to the average of core cities regions in the UK.
The International Public Policy Observatory (IPPO) suggests the higher levels of economic inactivity be seen as a health policy problem, rather than a labour market one. They suggest that responses should be holistic and locally focused, considering education, skills, childcare, housing alongside getting people into employment.
This also means broadening policy analysis to measure outcomes like better health and wellbeing to further address economic inactivity in the long-term.
Sources: Intelligence Hub analysis of APS, IPPO
Examining the reasons for economic inactivity helps to show the significant barriers to employment in GCR.
Looking at economic inactivity by reason – both positive and negative – we can see that GCR saw significant increases in economic inactivity in relation to the number of those ‘Looking After Family’ (the largest % point increase among UK Core City Regions).
Despite these being largely voluntary, those out of the labour market due to looking after family, may illustrate increased barriers to the labour market for parents and carers in GCR.
This has significant implications on inclusivity. For instance, the reliance on family members for social care due to the absence of affordable and accessible professional care services can disproportionately impact vulnerable populations, including those with disabilities, the elderly, and children from low-income families.
This can widen the gap in health and education outcomes across different segments of the population, diminishing Regional inclusivity and productivity.
| Largely Voluntary | Largely Involuntary | ||||
|---|---|---|---|---|---|
| Geography | Student | Looking after family | Retired | Temporarily sick | Long term sick |
| Greater Manchester | 28.9 | 19.5 | 10.4 | 2.5 | 29 |
| Liverpool City Region | 28 | 16.5 | 11.3 | 2.1 | 34.4 |
| North of Tyne | 20.5 | 19.6 | 15.4 | 2.1 | 31 |
| Sheffield City Region | 26 | 17.3 | 8.6 | 1.4 | 35.4 |
| West Midlands | 28.5 | 24.9 | 6.4 | 1.3 | 30.8 |
| Wet Yorkshire | 25.3 | 20.2 | 16.4 | 1.9 | 23.5 |
| West of England | 33.3 | 13.5 | 10.3 | 1.8 | 26.6 |
| Cardiff Capital Region | 23.3 | 20.4 | 12 | 1.4 | 32.9 |
| Glasgow City Region | 28.8 | 20.4 | 9.2 | 1.7 | 31.3 |
| Improvements Since 2022 | |
| Worsening Since 2022 | |
| No data available from 2022 |
Sources: Intelligence Hub analysis of APS
Greater Manchester Combined Authority (GMCA)’s action plan to address these health and work-related inequalities over the next five years focuses on helping people get back into work.
As part of the 2014 devolution deal, GMCA negotiated to deliver and design a localised version of the new Work and Health Programme. Since then, there are now around 90,500 more people in GMCA working. Some of their key learnings:
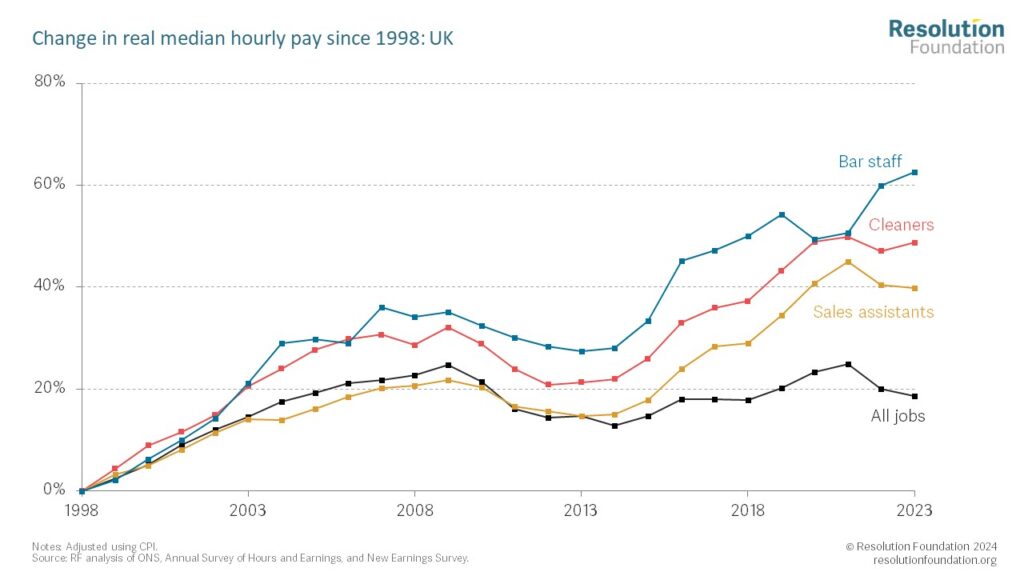
The growth in real median pay across different occupations shows the impact of the National Minimum Wage over the last 25 years.
The National Minimum Wage (NMW) is the minimum pay per hour most workers are legally entitled to. In 1999, this was an hourly wage of £3.60. After the introduction in 2016 of the National Living Wage (NLW), which is the rate payable to people aged 21 and over, it recently reached £11.44 from April 2024.
The Centre for Economic Performance and the Resolution Foundation have praised the policy in raising the wage floor and believe that it could go further to reach 73% of the median pay (£14 by 2029).
The opposite graph and table demonstrates the dramatic impact the National Living Wage has had on the distribution of wages. Since 1998, jobs like Bar Staff and Cleaners have experienced a stronger relative growth in wages than the average of All Jobs.
Applying this to Scotland, this has impacted the ratio between the highest and lowest earners in Scotland. This means that there is now a smaller gap between the 10th and 90th percentile of earners than seen in 1998.
Sources: Resolution Foundation, LSE, FT
| Year | 90th-10th |
|---|---|
| 1998 | 3.6 |
| 2008 | 3.4 |
| 2018 | 3.1 |
| 2023 | 2.9 |
Increases in wages have improved staff retention and productivity but may also increase costs for businesses.
The UK now has one of the highest wage floors in the developed world. But businesses have highlighted the impacts the policy has had:
Industry engagement undertaken by the National Institute of Economic and Social Research (NIESR) highlights some of the experiences of business:
“We make 85p on a cup of coffee, that has to pay for all this increase in wages and all the rest of it and energy… It’s unavoidable, it’s irresponsible to go into debt so you have to make a profit…We have to put our prices [up] every time the minimum wage goes up to cover our costs.” – Medium-sized employer, Hospitality
But another business owner suggested that it is manageable because other competitors also have to increase costs:
“Over the last year or so, I have increased the prices slowly and I’ve had very little push back, and I have to say, the National Minimum Wage is a really positive thing from my perspective, because when you write out and say that their fees are going to increase by x number of percent, they all know that the National Minimum Wage is going up… It’s not about me absorbing them, it’s a very simple business model, the National Minimum Wage goes up and I put up prices accordingly… It’s a really easy issue.” – Medium-sized Employer, Cleaning
Gross Domestic Product (GDP): The total monetary value of final good and services produced in a country in a given time period.
Consumer Price Index (CPI): Is a weighted-average of a basket of consumer goods and services purchased by households. Changes in measured CPI tracks changes in prices overtime.
Unemployment rate: Unemployed people are out of work but actively looking for a job and available to start work in the next two weeks. It is measured as the number of unemployed people divided by the number of economically active population (those in employment and those unemployed).
Real Household Disposable Income: Real disposable income is a measure of the purchasing power of a household or individual, considering the effect of inflation. It is calculated by subtracting taxes and other mandatory payments from a household’s disposable income, and then adjusting for inflation.
Economic Inactivity: People who are not in the workforce are classified as economically inactive and have not been seeking work for the last four weeks and cannot start in the next two weeks.
For queries and further information, please contact Will Harkiss: